")
1 / 1
$5.86
Free shipping
USED-Interactive Data Visualization for the Web: An Introduction to Designing with D3 by Scott Murray (Paperback)
Sold by ThriftBooks Shop
Condition:Please select
Very Good
Quantity:
About this shop
ThriftBooks Shop
4.6
66.3K Sold
440.9K+ Followers
89%24h response rate
67%Ships within 48h
88%Positive feedback
About the product
Details
| Number Of Pages | 270 |
| Year | 2013 |
| Publisher | O'Reilly Media |
| Isbn/Issn | 9781449339739 |
| Cover Type | Soft Cover |
| Language | English |
Description
About our used conditions ratings:·Like New: An apparently unread copy in excellent condition. The dust cover is intact, and the pages are clean and not marred by notes or folds of any kind.·Very Good: A copy that has been read, but remains in excellent condition. May have writing on the inside cover but pages are unmarred.·Good: A copy that has been read, but remains in clean condition. All pages and covers are intact. The spine may show signs of wear. Pages can include limited notes and highlighting, and the copy can include "From the library of" labels or previous owner inscriptions. Create and publish your own interactive data visualization projects on the Web--even if you have little or no experience with data visualization or web development. It's easy and fun with this practical, hands-on introduction. Author Scott Murray teaches you the fundamental concepts and methods of D3, a JavaScript library that lets you express data visually in a web browser. Along the way, you'll expand your web programming skills, using tools such as HTML and JavaScript. This step-by-step guide is ideal whether you're a designer or visual artist with no programming experience, a reporter exploring the new frontier of data journalism, or anyone who wants to visualize and share data. Learn HTML, CSS, JavaScript, and SVG basics Dynamically generate web page elements from your data--and choose visual encoding rules to style them Create bar charts, scatter plots, pie charts, stacked bar charts, and force-directed layouts Use smooth, animated transitions to show changes in your data Introduce interactivity to help users explore data through different views Create customized geographic maps with data Explore hands-on with downloadable code and over 100 examples 1.11 pounds
Similar Items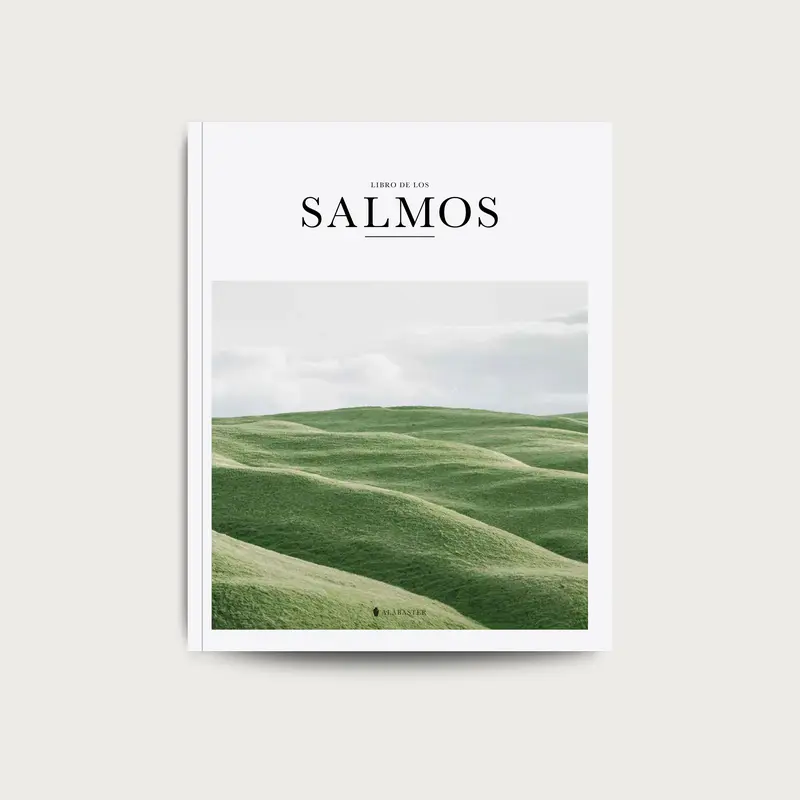


![A Theory of Dreaming Deluxe Limited Edition: Sequel to A Study in Drowning by Ava Reid [Hardback Book]](https://p16-oec-general-useast5.ttcdn-us.com/tos-useast5-i-omjb5zjo8w-tx/c503ce7e61784895a4b76f29c924a3c5~tplv-fhlh96nyum-resize-webp:800:800.webp?dr=12190&t=555f072d&ps=933b5bde&shp=8dbd94bf&shcp=c6ba62f6&idc=useast5&from=2378011839)

![Day Trading Attention: How to Actually Build Brand and Sales in the New Social Media World by Gary Vaynerchuk [Hardback Book]](https://p16-oec-general-useast5.ttcdn-us.com/tos-useast5-i-omjb5zjo8w-tx/7dac9befa4f54491b9b2975838b85c80~tplv-fhlh96nyum-resize-webp:800:996.webp?dr=12190&t=555f072d&ps=933b5bde&shp=8dbd94bf&shcp=c6ba62f6&idc=useast5&from=2378011839)


![Howl’s Moving Castle Deluxe Limited Edition by Diana Wynne Jones [Hardback Book] Luminous Artwork & Foil Stamping 2025 Release](https://p16-oec-general-useast5.ttcdn-us.com/tos-useast5-i-omjb5zjo8w-tx/f87a17fe0d604dcfb5655375caca6d0c~tplv-fhlh96nyum-resize-webp:800:800.webp?dr=12190&t=555f072d&ps=933b5bde&shp=8dbd94bf&shcp=c6ba62f6&idc=useast5&from=2378011839)
![The Constitution of the United States and Other Patriotic Documents by Gregg Jarrett [Hardback Book] Series](https://p16-oec-general-useast5.ttcdn-us.com/tos-useast5-i-omjb5zjo8w-tx/d33ff10b98304338b1dda3f50b268a28~tplv-fhlh96nyum-resize-webp:800:800.webp?dr=12190&t=555f072d&ps=933b5bde&shp=8dbd94bf&shcp=c6ba62f6&idc=useast5&from=2378011839)
![Coraline 10th Anniversary Edition by Neil Gaiman [Paperback Book] A chilling tale of courage and curiosity for all ages.](https://p16-oec-general-useast5.ttcdn-us.com/tos-useast5-i-omjb5zjo8w-tx/d5b7e63652474398ae49608747b671fc~tplv-fhlh96nyum-resize-webp:800:800.webp?dr=12190&t=555f072d&ps=933b5bde&shp=8dbd94bf&shcp=c6ba62f6&idc=useast5&from=2378011839)
![Defining Moments in Black History: Reading Between the Lies by Dick Gregory [Paperback Book]](https://p16-oec-general-useast5.ttcdn-us.com/tos-useast5-i-omjb5zjo8w-tx/60b73c4f1fb642f7942fdabb51dae2bd~tplv-fhlh96nyum-resize-webp:648:648.webp?dr=12190&t=555f072d&ps=933b5bde&shp=8dbd94bf&shcp=c6ba62f6&idc=useast5&from=2378011839)

![Identifying and Harvesting Edible and Medicinal Plants by Steve Brill||Evelyn Dean [Paperback Book]](https://p16-oec-general-useast5.ttcdn-us.com/tos-useast5-i-omjb5zjo8w-tx/c0d62b6e8ef34dc59663e327149a8395~tplv-fhlh96nyum-resize-webp:600:768.webp?dr=12190&t=555f072d&ps=933b5bde&shp=8dbd94bf&shcp=c6ba62f6&idc=useast5&from=2378011839)
Alabaster
Alabaster Libro de los Salmos - Alabaster Bible (NTV Spanish Edition)
Free shipping
4.8
1.8K sold$39.00
![Zip It: The Keep It Shut 40-Day Challenge by Karen Ehman [Paperback Book] A daily guide for word usage and reflection on what to say, how to say it, and when to remain silent.](https://p16-oec-general-useast5.ttcdn-us.com/tos-useast5-i-omjb5zjo8w-tx/5566d5f4cafe4984ac65e8d5c6da379d~tplv-fhlh96nyum-resize-webp:800:800.webp?dr=12190&t=555f072d&ps=933b5bde&shp=8dbd94bf&shcp=c6ba62f6&idc=useast5&from=2378011839)
![How to Invest $50-$5,000 10e: The Small Investor's Step-by-Step Plan for Low-Risk Investing in Today's Economy by Nancy Dunnan [Paperback Book] Finance Tutorial](https://p16-oec-general-useast5.ttcdn-us.com/tos-useast5-i-omjb5zjo8w-tx/41c6ebc9ad0048d9baa3b3873321bc74~tplv-fhlh96nyum-resize-webp:800:800.webp?dr=12190&t=555f072d&ps=933b5bde&shp=8dbd94bf&shcp=c6ba62f6&idc=useast5&from=2378011839)
![Tiny Humans, Big Emotions: How to Navigate Tantrums, Meltdowns, and Defiance to Raise Emotionally Intelligent Children by Alyssa Blask Campbell||Lauren Elizabeth Stauble [Paperback Book]](https://p19-oec-general-useast5.ttcdn-us.com/tos-useast5-i-omjb5zjo8w-tx/491151ae1a63492a9d64588b6a94b531~tplv-fhlh96nyum-resize-webp:800:800.webp?dr=12190&t=555f072d&ps=933b5bde&shp=8dbd94bf&shcp=c6ba62f6&idc=useast5&from=2378011839)
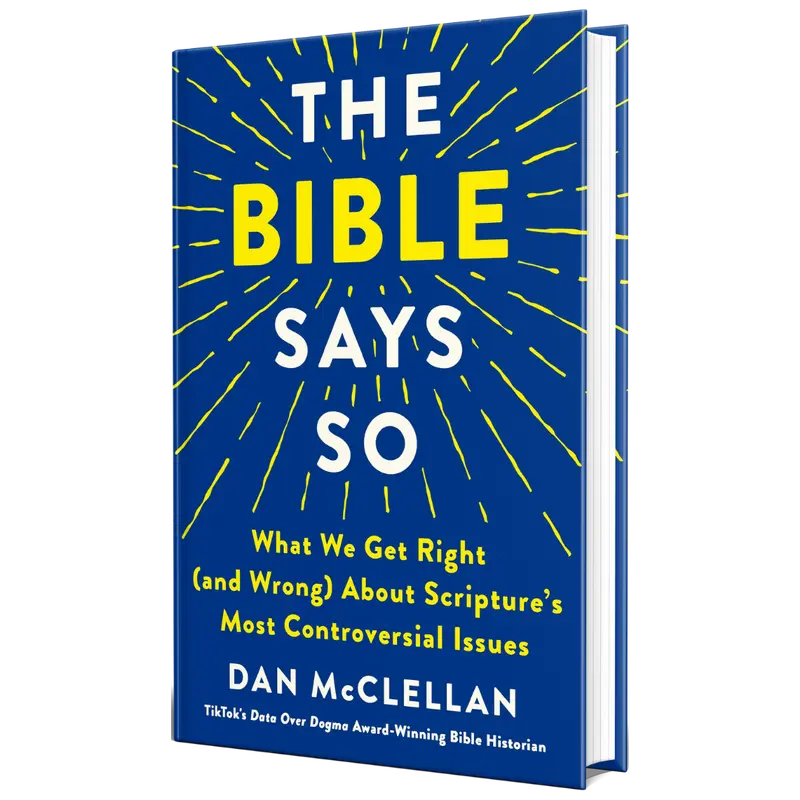
Macmillan Publishers
The Bible Says So: What We Get Right (and Wrong) About Scripture’s Most Controversial Issues by Dan McClellan (Hardcover)
Free shipping
4.8
3.6K sold$30.00
Alabaster
Alabaster Bible Study Gift Set: A Bundle for Her and Him
Free shipping
4.8
16.8K sold$59.50
$70.00HarperCollins
A Theory of Dreaming Deluxe Limited Edition: Sequel to A Study in Drowning by Ava Reid [Hardback Book]
4.9
389 sold$18.74
$24.99![Perdona lo que no puedes olvidar: Descubre cómo seguir adelante, hacer las paces con recuerdos dolorosos y crear una vida nuevamente hermosa by Lysa TerKeurst [Paperback Book] Workbook](https://p16-oec-general-useast5.ttcdn-us.com/tos-useast5-i-omjb5zjo8w-tx/b31f7cdb1f6f4c4688c701622957ce82~tplv-fhlh96nyum-resize-webp:800:800.webp?dr=12190&t=555f072d&ps=933b5bde&shp=8dbd94bf&shcp=c6ba62f6&idc=useast5&from=2378011839)
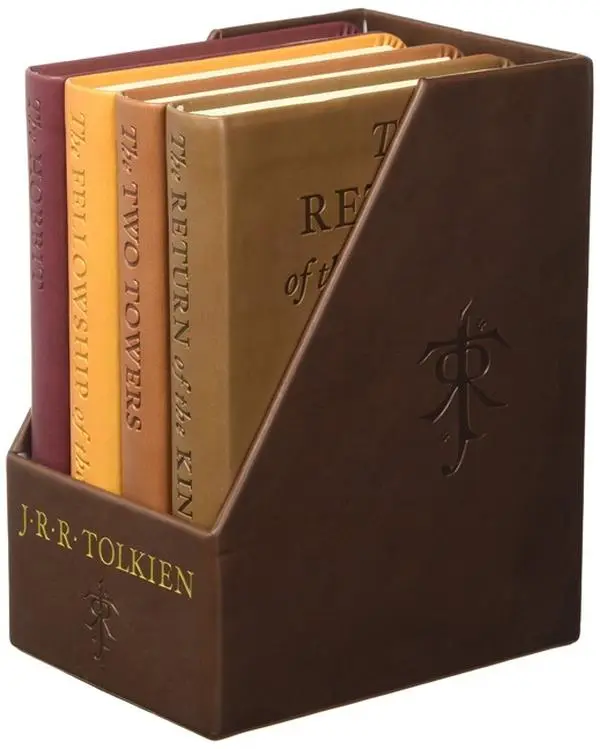
HarperCollins
The Hobbit And The Lord Of The Rings: Deluxe Pocket Boxed Set - Leather Bound Gold Foil Stamped Special Edition Hardback Omnibus Edition Bundle
Free shipping
4.9
3.0K sold$44.99
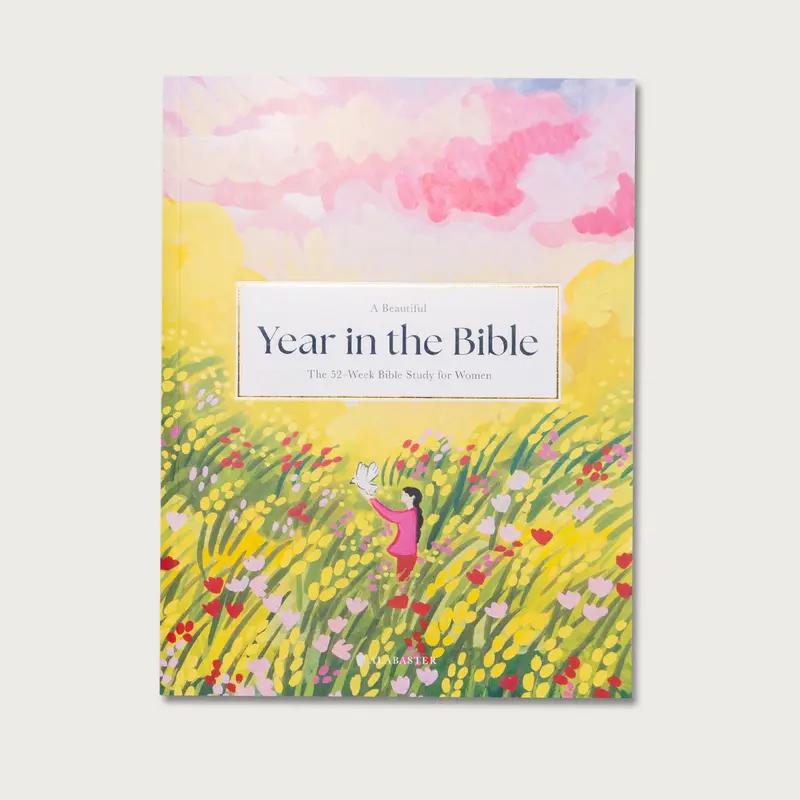
$59.99Alabaster
Alabaster A Beautiful Year in the Bible: The 52-Week Bible Study for Women Daily Devotional Journal with Thoughtful Prompts & Suggested Readings (Soft-Cover)
Free shipping
4.9
72.2K sold$35.10
$39.00Macmillan Publishers
The Antiquarian Sticker Book: Over 1,000 Exquisite Victorian Stickers by Odd Dot (The Antiquarian Sticker Book Series) (Hardcover)
Free shipping
4.9
1.9K sold$27.99
HarperCollins
Day Trading Attention: How to Actually Build Brand and Sales in the New Social Media World by Gary Vaynerchuk [Hardback Book]
Free shipping
4.7
504 sold$30.00
$40.00Clean Skin Club Shop
Clean Skin Club Clean² Blemish Control Face Pads – Extra Large Dual-Sided Face Pads for Blemish-Prone Skin, 100% Bio-Based, Dermatologist Approved, 60 Count
4.9
1.7K sold$7.00
$10.00HarperCollins
Howl’s Moving Castle Deluxe Limited Edition by Diana Wynne Jones [Hardback Book] Luminous Artwork & Foil Stamping 2025 Release
4.9
7.7K sold$18.74
$24.99HarperCollins
The Constitution of the United States and Other Patriotic Documents by Gregg Jarrett [Hardback Book] Series
4.8
6.8K sold$26.25
$35.00HarperCollins
Coraline 10th Anniversary Edition by Neil Gaiman [Paperback Book] A chilling tale of courage and curiosity for all ages.
4.8
8.5K sold$7.49
$9.99HarperCollins
Defining Moments in Black History: Reading Between the Lies by Dick Gregory [Paperback Book]
4.6
2.5K sold$11.99
$15.99Alabaster
Alabaster The Good and Beautiful Bible Study Volume 1 - Guided Spiritual Bible Study with Daily Prayers and Contemplative Artwork, Thoughtful Gift for Men
Free shipping
4.8
168.7K sold$22.50
$25.00Hachette Book Group
Pussypedia: A Comprehensive Encyclopedia by Zoe Mendelson - Books
Free shipping
4.7
1.9K sold$35.00
HarperCollins
Identifying and Harvesting Edible and Medicinal Plants by Steve Brill||Evelyn Dean [Paperback Book]
4.9
1.3K sold$17.99
$23.99View more
TikTok Shop promo codesAbout TikTok ShopSeller centerContact usCareersAffiliateHelp centerSafety centerCommunity guidelinesPrivacy policyTransparencyAccessibility
Free shipping
New customer deals


Shop now in app